In this document we will briefly practice working with different vector types. Follow the instructions in the comments of each code chunk.
Exercise 1 - Creating and examining vectors
# In a recent coding competition, Liz came first, Alex came second # and Jiena came third.# here is a vector with their namesname <-c("Alex", "Jiena", "Liz")# Check that this vector is a character vector of length 3str(name)
chr [1:3] "Alex" "Jiena" "Liz"
# Create a corresponding numeric vector with each person's position.position <-c(2, 3, 1)
# Check that your vector is a numeric vector of length three.str(position)
num [1:3] 2 3 1
Exercise 2 - Converting vectors to factors and ordered factors
# Convert the 'name' character vector to a factor vector called 'name_factor'.# Check that the conversion succeeded.name_factor <-as.factor(name)str(name_factor)
Factor w/ 3 levels "Alex","Jiena",..: 1 2 3
# Convert your 'name' character vector to an ordered factor vector# in increasing position order. Check that the conversion succeeded. name_ordered <-ordered(name, levels =c("Jiena", "Alex", "Liz"))str(name_ordered)
Ord.factor w/ 3 levels "Jiena"<"Alex"<..: 2 1 3
# EXTENSION: Use a function to display the vector in order of position (highest to lowest)?sort(name_ordered, decreasing =TRUE)
[1] Liz   Alex  Jiena
Levels: Jiena < Alex < Liz
Exercise 3 - Loading and inspecting dataframes
# Here is a URL for on online csv of data about charity donationsurl <-"https://peopleanalytics-regression-book.org/data/charity_donation.csv"# Download this into a dataframe with a name of your choicecharity_data <-read.csv(url)
# Inspect the dataframe to find out how many rows of data there are# and what the columns names and data types arestr(charity_data)
Exercise 4 - Using functions, packages and the pipe operator
# Load the dplyr package
library(dplyr)
Attaching package: 'dplyr'
The following objects are masked from 'package:stats':

    filter, lag
The following objects are masked from 'package:base':

    intersect, setdiff, setequal, union
# Seek help on the functions filter() and pull() from dplyr# What do these functions do and what are their arguments??dplyr::filter?dplyr::pull
# Using the pipe operator, write code to calculate the average amount# donated by Rural Domestic individuals, rounded to the nearest dollar.# Remember that == (double equals) is used for precise equalitycharity_data |> dplyr::filter(reside =="Rural Domestic") |> dplyr::pull(total_donations) |>mean() |>round()
[1] 2565
## EXTENSION: Write similar code to calculate the average amount donated ## by males the age range of 30-39 inclusive, rounded to the nearest dollarcharity_data |> dplyr::filter(gender =="M", age %in%30:39) |> dplyr::pull(total_donations) |>mean() |>round()
[1] 2187
Exercise 5 - Plotting and graphing
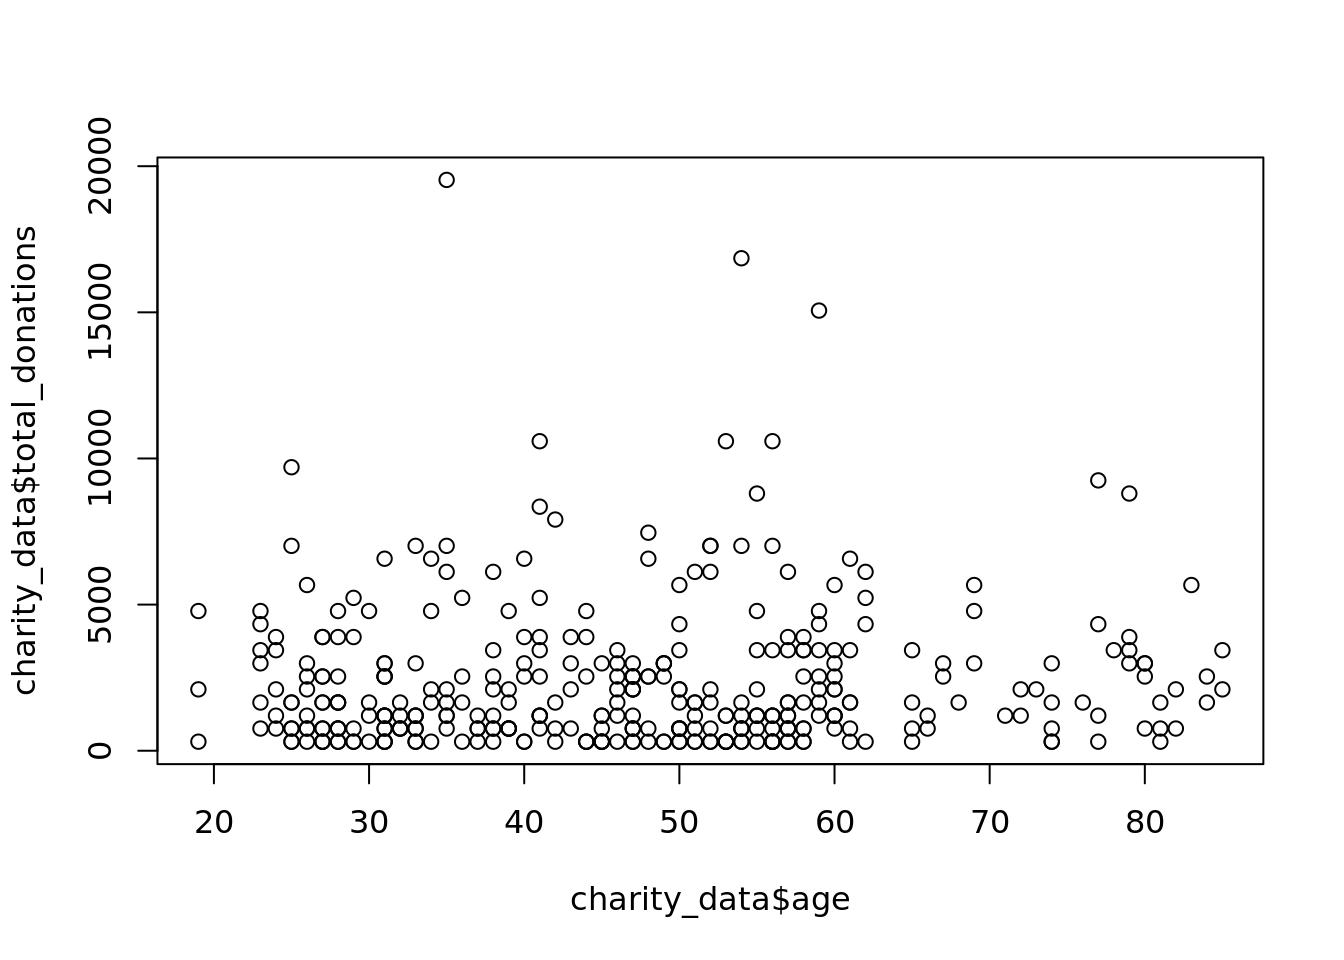
# Using your charity dataset from the previous exercises, plot# total_donations (y-axis) against age (x-axis)plot(charity_data$age, charity_data$total_donations)
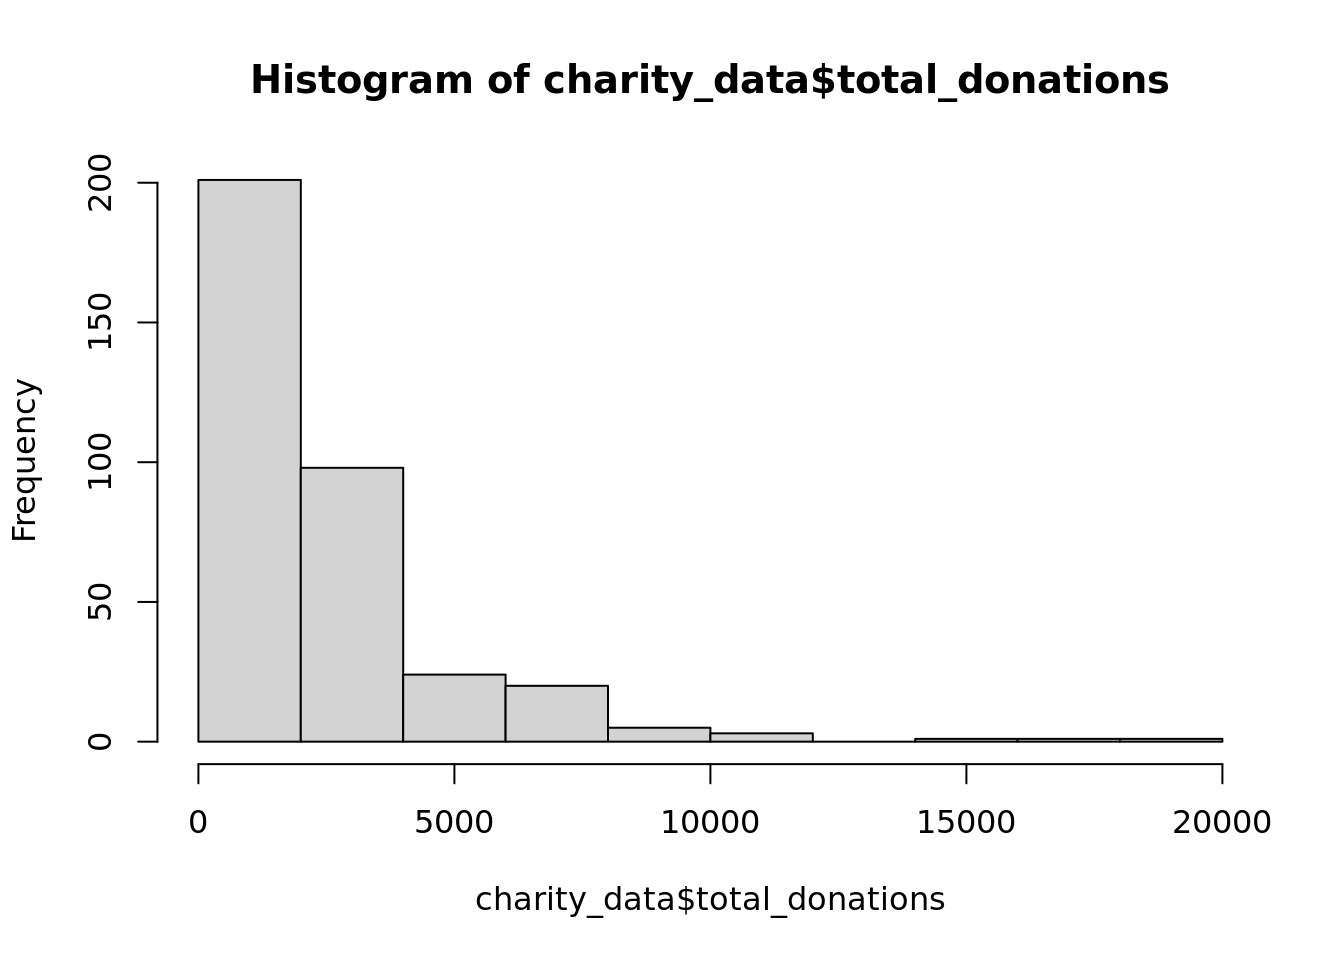
# Using an appropriate function, plot a histogram of total donations.# Use Help if you need to.hist(charity_data$total_donations)
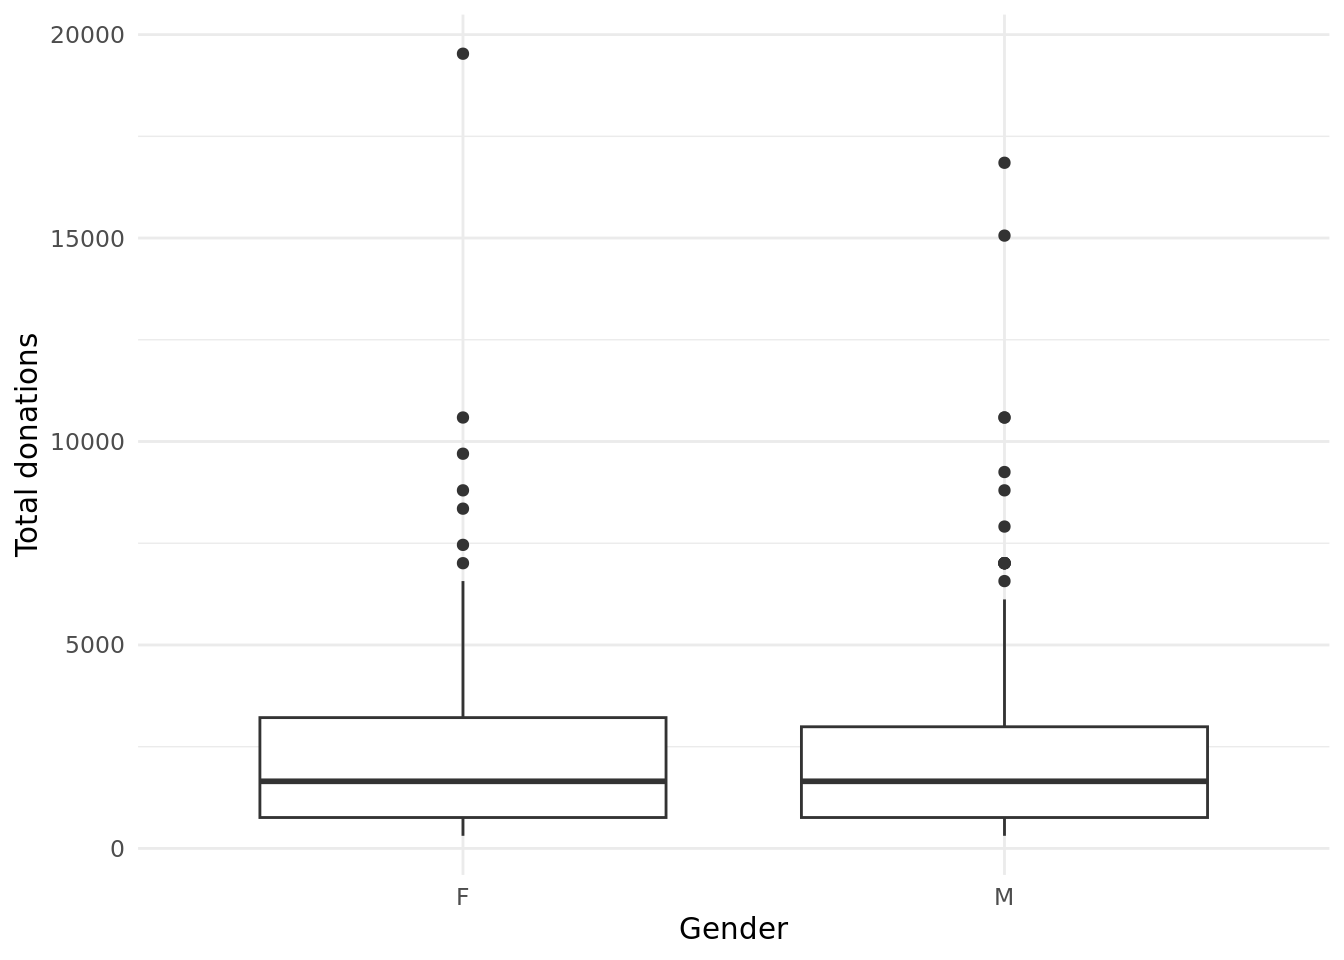
# EXTENSION: If you know ggplot2, use it to create a boxplot of# total donations grouped by gender.library(ggplot2)ggplot(data = charity_data, aes(x = gender, y = total_donations)) +geom_boxplot() +labs(x ="Gender", y ="Total donations") +theme_minimal()
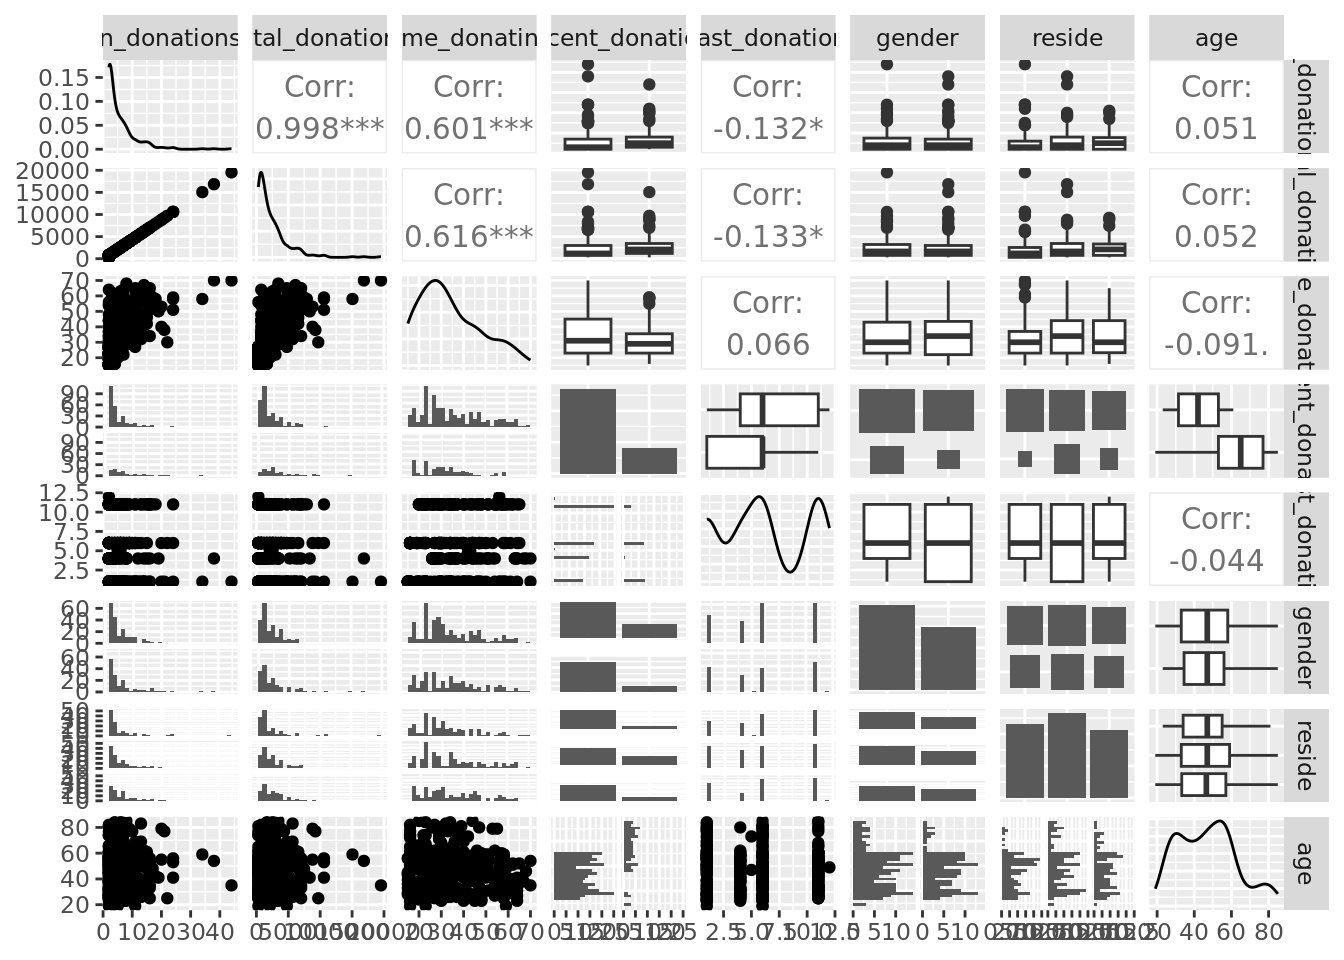
# EXTENSION: Run a pairplot to see if you can identify interesting patterns# in the charity_data dataset. Remember to consider the data types.library(GGally)charity_data <- charity_data |> dplyr::mutate(across(c("recent_donation", "gender", "reside"), as.factor) )GGally::ggpairs(charity_data)
`stat_bin()` using `bins = 30`. Pick better value `binwidth`.
`stat_bin()` using `bins = 30`. Pick better value `binwidth`.
`stat_bin()` using `bins = 30`. Pick better value `binwidth`.
`stat_bin()` using `bins = 30`. Pick better value `binwidth`.
`stat_bin()` using `bins = 30`. Pick better value `binwidth`.
`stat_bin()` using `bins = 30`. Pick better value `binwidth`.
`stat_bin()` using `bins = 30`. Pick better value `binwidth`.
`stat_bin()` using `bins = 30`. Pick better value `binwidth`.
`stat_bin()` using `bins = 30`. Pick better value `binwidth`.
`stat_bin()` using `bins = 30`. Pick better value `binwidth`.
`stat_bin()` using `bins = 30`. Pick better value `binwidth`.
`stat_bin()` using `bins = 30`. Pick better value `binwidth`.
`stat_bin()` using `bins = 30`. Pick better value `binwidth`.
`stat_bin()` using `bins = 30`. Pick better value `binwidth`.
`stat_bin()` using `bins = 30`. Pick better value `binwidth`.
Exercise 6 - Documenting in Quarto
# Render this document into a HTML file using the 'Render' button# View your output